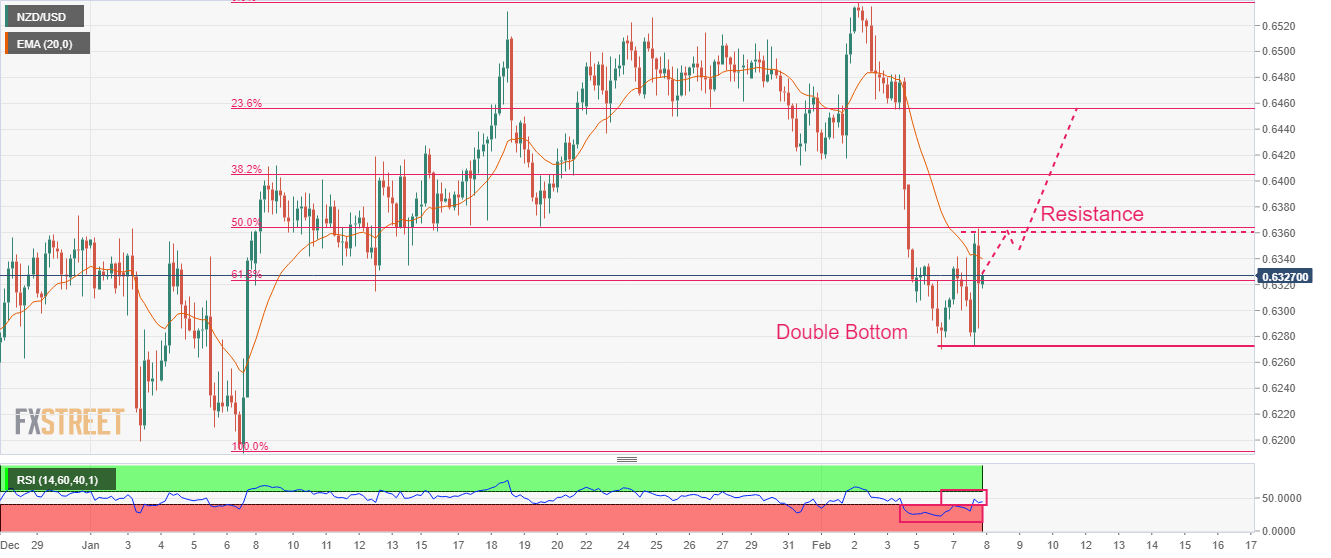
NZD/USD Price Analysis: Sees stability above 61.8% Fibo after a bullish reversal
- A confirmation of more interest rate hikes by the Fed has strengthened the US Treasury yields.
- NZD/USD has scaled above 61.8% Fibo retracement after a bullish reversal supported by the double bottom formation.
- The RSI (14) has shifted into the 40.00-60.00 zone from the bearish range, which adds to the bullish reversal filters.
The NZD/USD pair is displaying topsy-turvy moves in the early Asian session after rebounding from 0.6290 on Tuesday. The Kiwi asset is expected to extend its recovery towards the critical resistance of 0.6360 as the market mood is cheerful after investors shrugged off volatility inspired by the hawkish speech from Federal Reserve (Fed) chair Jerome Powell.
S&P500 witnessed stellar buying interest as investors were already expecting a continuation of policy tightening by the Fed to tame higher inflation. The US Dollar Index (DXY) has surrendered the 103.00 support as investors shunned the risk aversion theme. However, the confirmation of more interest rate hikes by the Fed accelerated return from 10-year US Treasury bonds to 3.68%.
NZD/USD has formed a Double Bottom chart pattern on a three-hour scale after dropping below the 61.8% Fibonacci retracement (placed from January 6 low at 0.6190 to February 2 high at 0.6538) at 0.6327. The aforementioned chart pattern plotted around 0.6272 indicates a bullish reversal amid the absence of significant selling interest while testing previous lows. A bullish reversal after testing previous lows has pushed the Kiwi asset above 61.8% Fibo retracement again.
The Kiwi asset is still below the 20-period Exponential Moving Average (EMA) at 0.6400, indicating that the upside bias is still not in the picture.
However, a range shift by the Relative Strength Index (RSI) (14) into the 40.00-60.00 zone from the bearish range of 20.00-40.00 adds to the bullish reversal filters.
For an upside move, the New Zealand Dollar is required to push the asset above the 50% Fibo retracement placed at 0.6364, which will drive the asset toward January 9 high at 0.6412 followed by January 25 low around 0.6450.
On the flip side, a breakdown below February 6 low at 0.6270 will drag the asset toward December 22 low at 0.6230. A slippage below the latter will expose the Kiwi for more downside toward January 6 low at 0.6190.
NZD/USD three-hour chart