Back
15 Mar 2023
USD Index Price Analysis: The hunt for 105.00 and above
- DXY regains unusually strong upside traction and targets 105.00.
- The 100-day SMA at 104.95 emerges as the initial hurdle.
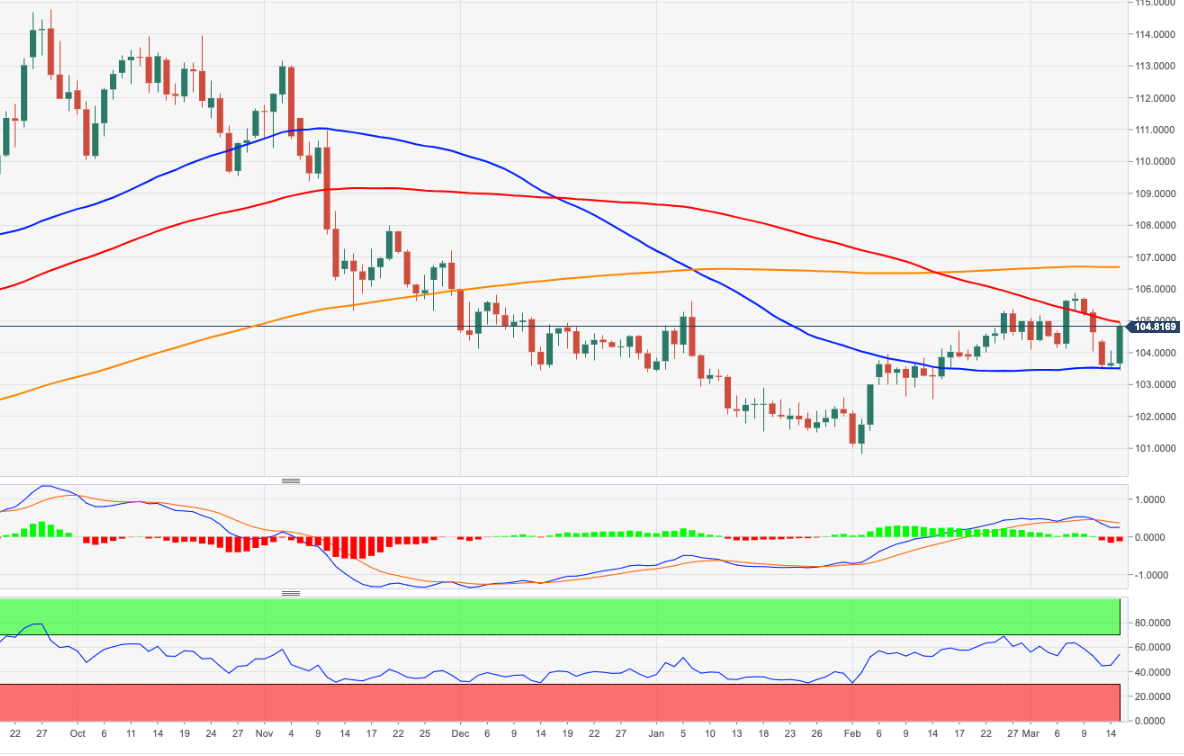
DXY gathers intense buying interest and climbs to 3-day highs near the 105.00 region on Tuesday, an area also underpinned by the temporary 100-day SMA.
The continuation of the strong rebound is expected to challenge the so far 2023 high at 105.88 (March 8) prior to the key 200-day SMA, today at 106.64.
Looking at the broader picture, while below the 200-day SMA, the outlook for the greenback is expected to remain negative.
DXY daily chart