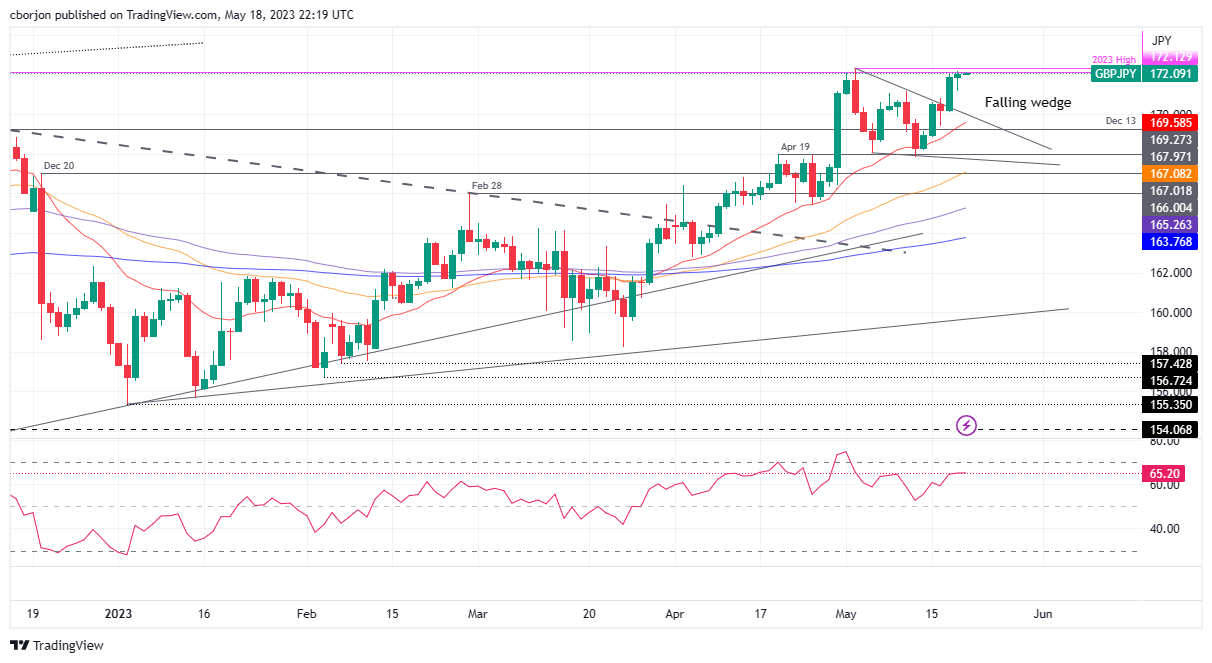
GBP/JPY Price Analysis: Climbs to new weekly highs, nearby the YTD high
- GBP/JPY rises to a fresh weekly high of 172.16, supported by a breakout from a falling wedge pattern.
- Upside targets include resistance levels at 173.00 and the psychological barrier at 175.00, with 2016 high at 177.87 as the ultimate target.
- A potential double-top formation could be confirmed if GBP/JPY breaks the May 11 daily low of 167.84.
GBP/JPY rose to a fresh weekly high of 172.16 after a confirmed upbreak of a falling wedge, a bullish chart pattern, though it fell shy of achieving a new year-to-date (YTD) high of 172.33. At the time of writing, the GBP/JPY is trading at 172.07 as the Asian session begins.
GBP/JPY Price Analysis: Technical outlook
The daily chart shows that the GBP/JPY is upward biased, though it remains shy of testing the YTD high, which could pave the way for further upside. Noteworthy that the Relative Strength Index (RSI) indicator is registering lower peaks contrarily to GBP/JPY’s price action, achieving higher highs. That means a negative divergence is forming between price action and oscillators, warranting of further losses.
Additionally, the GBP/JPY could be forming a double-top, which could be confirmed once the pair cracks the May 11 daily low of 167.84.
If GBP/JPY cracks the YTD high, the next resistance would be 173.00, and the psychological barrier 175.00. A breach of the latter will clear the path to test the 2016 high at 177.87.
Conversely, a GBP/JPY’s fall below 172.00 could pave the way for a correction. Firstly, the GBP/JPY could dip toward the May 16 high at 170.83. Once cleared, the next demand area would be the 170.00 figure, followed by the confluence of the falling-wedge top trendline and the 20-day Exponential Moving Average (EMA) at the 169.50-70 area.
GBP/JPY Price Action – Daily chart