Gold Price Forecast: XAU/USD crawls above $1,910 as US NFP comes under spotlight
- Gold price has moved higher at a snail’s pace to near $1,915.00 ahead of US NFP data.
- S&P500 futures are consistently extending losses as investors are anxious ahead of the labor market data.
- Gold price is in an inventory adjustment stage in which inventory is exchanged among institutional investors and retail participants.
Gold price (XAU/USD) is demonstrating a dull performance after a wild spike-triggered post the release of the United States Automatic Data Processing (ADP) Employment report. The precious metal has walked briskly to near $1,915.00 and is expected to remain sideways ahead of the US Nonfarm Payrolls (NFP) data.
S&P500 futures are consistently extending losses as investors are anxious ahead of the labor market data and upcoming corporate earnings season. The US Dollar Index (DXY) is displaying a subdued performance. The upside for the USD index is restricted near 103.20 for now but bulls can make a comeback if NFP data turns out resilient.
Following a subdued lead from the USD Index, US Treasury yields are also sideways. The yields offered on 10-year US Treasury bonds are hovering around 4.04%.
Meanwhile, all eyes are set on the US NFP data. Analysts at Citi expect after a surprisingly strong 339K increase in nonfarm payrolls in May, we expect a slowing in employment growth in June, although a still-solid 170K jobs were added during the month. This could also be a temporarily softer month of payroll growth with upside risks again to payrolls from July through September. After the unemployment rate unexpectedly rose to 3.7% in May, we expect a decline to 3.6% in June with downside risks.
Gold technical analysis
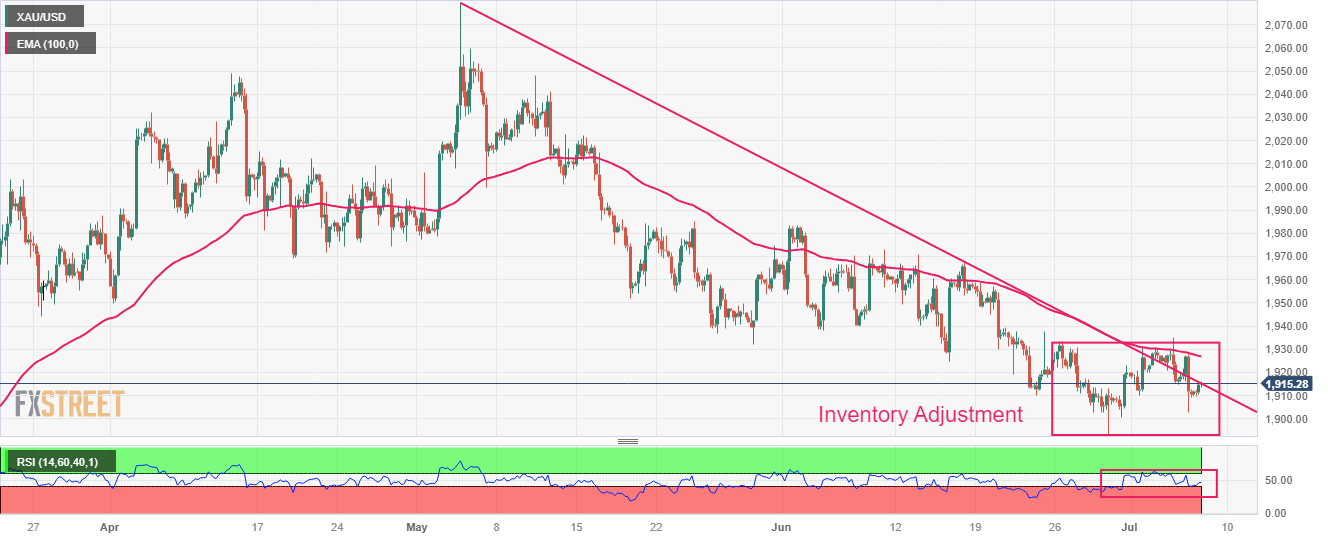
Gold price is auctioning in an inventory adjustment stage in which inventory is exchanged among institutional investors and retail participants on a four-hour scale. It would be early calling the adjustment process as an ‘accumulation’ or a ‘distribution’ until a decisive move.
The downward-sloping trendline from May 03 high at $2,079.76 and the 100-period Exponential Moving Average (EMA) at $1,926.65 will continue to act as a major barricade for the Gold bulls.
Meanwhile, the Relative Strength Index (RSI) (14) is oscillating in the 40.00-60.00 range, awaiting a potential trigger.
Gold four-hour chart