EUR/USD Price Analysis: Euro climbs toward 1.1200 as bullish sentiment builds
- EUR/USD trades near the 1.1200 zone after strong gains in Tuesday’s session.
- Mixed momentum signals, but broader trend remains positive with long-term support.
- Key support levels hold below, while resistance aligns near recent highs.
The EUR/USD pair advanced on Tuesday, trading near the 1.1200 zone after the European session, reflecting a strong bullish tone as the market approaches the Asian session. Price action remains near the top of the daily range, suggesting that buyers maintain control despite mixed momentum readings. The broader technical picture remains constructive, with several longer-term moving averages reinforcing the overall uptrend.
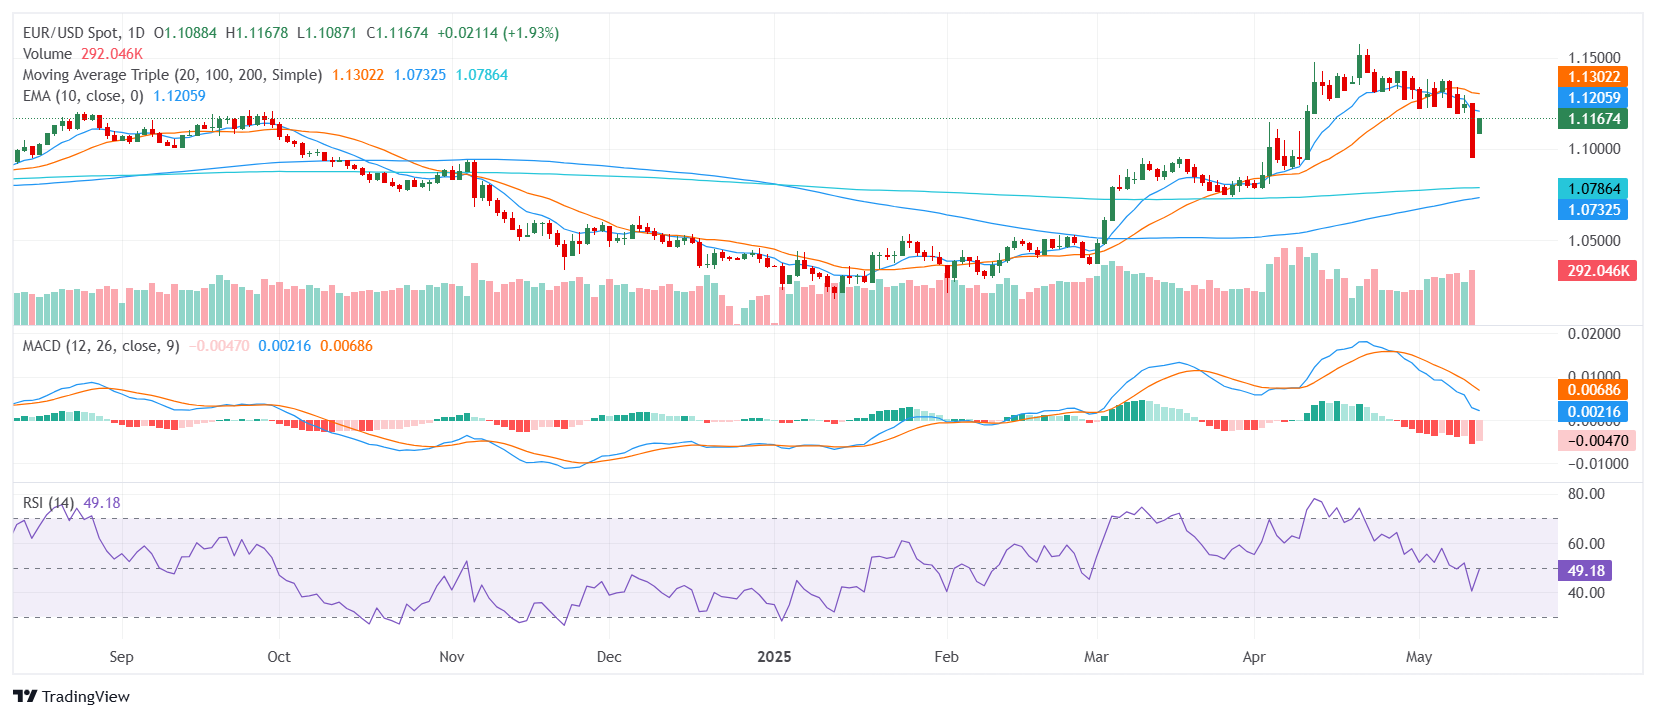
From a technical perspective, the pair presents a mixed but generally positive outlook. The Relative Strength Index sits in the 40s, indicating balanced momentum without immediate overbought conditions. The Moving Average Convergence Divergence, however, continues to flash a sell signal, hinting at potential short-term resistance. Meanwhile, the Bull Bear Power indicator supports the buy bias, adding weight to the bullish case. The Ultimate Oscillator also holds in the 40s, reflecting a cautious tone, while the Stochastic %K, trading near 16, flashes a clear buy signal, indicating potential for further gains.
The broader trend structure is supported by key moving averages. The 100-day and 200-day Simple Moving Averages, along with the 50-day Exponential Moving Average and 50-day Simple Moving Average, all align with the buy sentiment, reinforcing the underlying uptrend. However, the 20-day Simple Moving Average remains a headwind, suggesting that the path higher may still face resistance.
Support levels cluster around 1.1132, 1.1084, and 1.1083. Resistance is found at 1.1197, 1.1230, and 1.1242. A sustained move above the immediate resistance zone could confirm a broader breakout, while a drop below support might trigger a short-term correction, potentially testing the lower end of the recent range.
Daily Chart