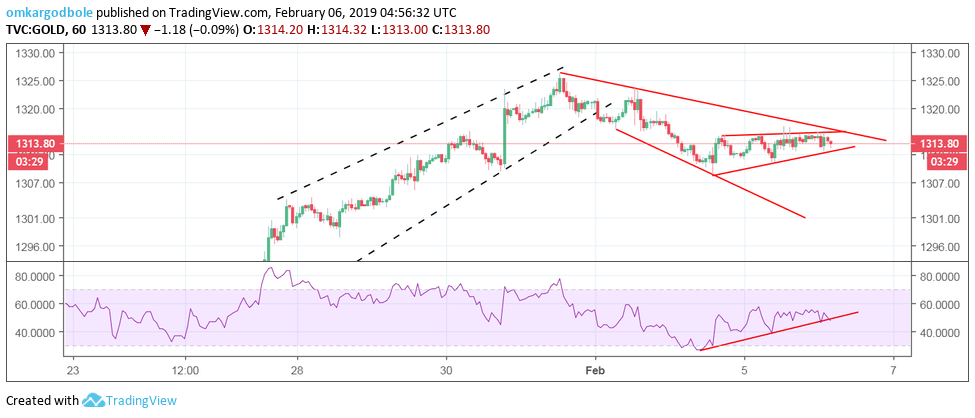
Gold Technical Analysis: trapped in an expanding falling channel in the hourly chart
Gold is currently trading in a sideways manner within an expanding falling channel, as seen in the chart below.
Hourly chart

- The relative strength index (RSI) has dived out of the ascending trendline. So, the metal could take out the lower edge of the minor sideways channel, currently at $1,312. That would open up downside toward $1,308-$1,305.
- A break above the falling channel hurdle at $1,316 would imply an end of the corrective pullback and could yield a rally to levels above $1,320.
Trend: bearish below $1,312
XAU/USD
Overview:
Today Last Price: 1313.5
Today Daily change: -1.76 pips
Today Daily change %: -0.13%
Today Daily Open: 1315.26
Trends:
Daily SMA20: 1296.91
Daily SMA50: 1272.58
Daily SMA100: 1245.75
Daily SMA200: 1230.24
Levels:
Previous Daily High: 1316.85
Previous Daily Low: 1310.1
Previous Weekly High: 1326.25
Previous Weekly Low: 1297.8
Previous Monthly High: 1326.25
Previous Monthly Low: 1275.9
Daily Fibonacci 38.2%: 1314.27
Daily Fibonacci 61.8%: 1312.68
Daily Pivot Point S1: 1311.29
Daily Pivot Point S2: 1307.32
Daily Pivot Point S3: 1304.54
Daily Pivot Point R1: 1318.04
Daily Pivot Point R2: 1320.82
Daily Pivot Point R3: 1324.79
