Back
22 Jul 2019
GBP/USD technical analysis: Cable off daily lows trading sub-1.2478 in the New York session
- GBP/USD starts the week by weakening below the 1.2500 figure.
- The level to beat for bears are at 1.2433 and 1.2388, according to the Technical Confluences Indicator.
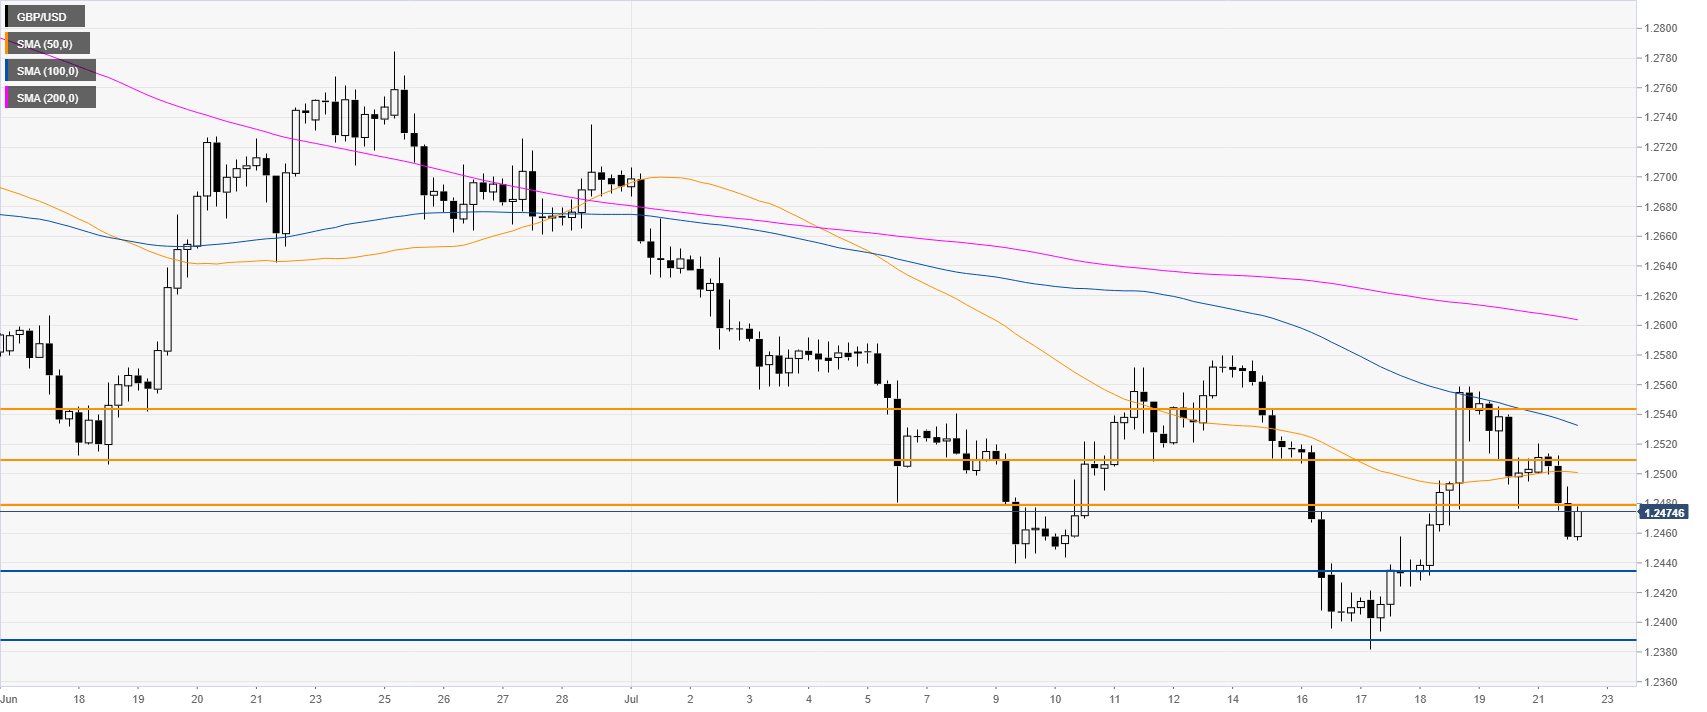
GBP/USD daily chart
Cable is trading in a bear trend below its main daily simple moving averages (DSMAs). The US Dollar is stronger accross the board as the market is antcipating smaller rate cuts.

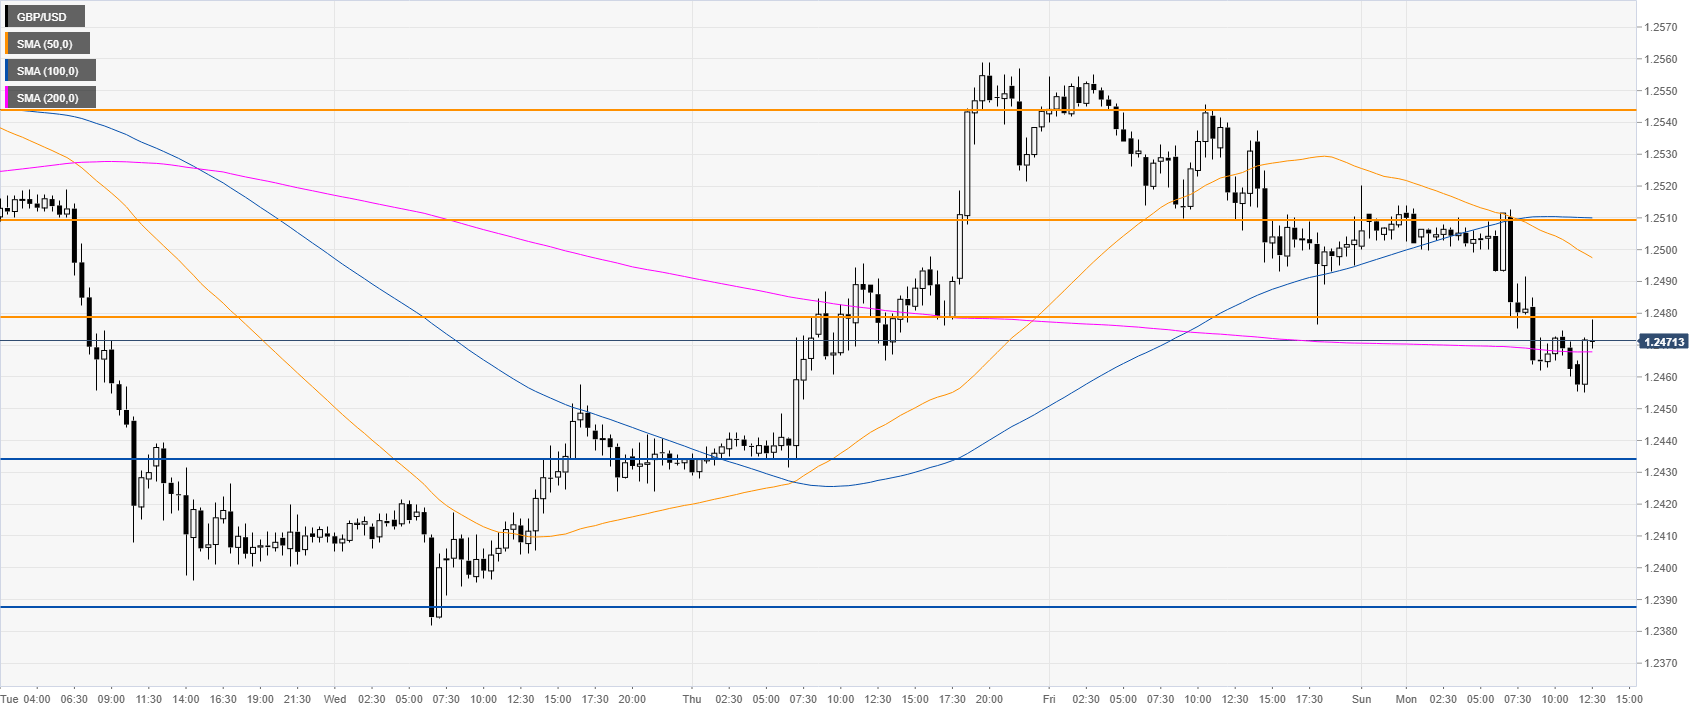
GBP/USD 4-hour chart
Cable is trading below the 1.2478 resistance and the main SMAs. If bears break below the current daily low at 1.2455 they could drive the market down towards 1.2433 and 1.2388, according to the Technical Confluences Indicator.
GBP/USD 30-minute chart
GBP/USD is off the daily lows challenging the 200 SMA. The 50 SMA crossed below the 100 SMA wich can be considered bearish. Immediate resistances are seen at 1.2478 and 1.2543.
Additional key levels