Back


9 Aug 2019
EUR/GBP technical analysis: Euro skyrocketing against Pound, flirting with 0.9300 near 2-year highs
- Pond weakness is triggering a robust bullish reaction on the EUR/GBP currency pair.
- The level to beat for bulls are seen at the 0.9293 level, followed by 0.9313 and 0.9371 resistances.
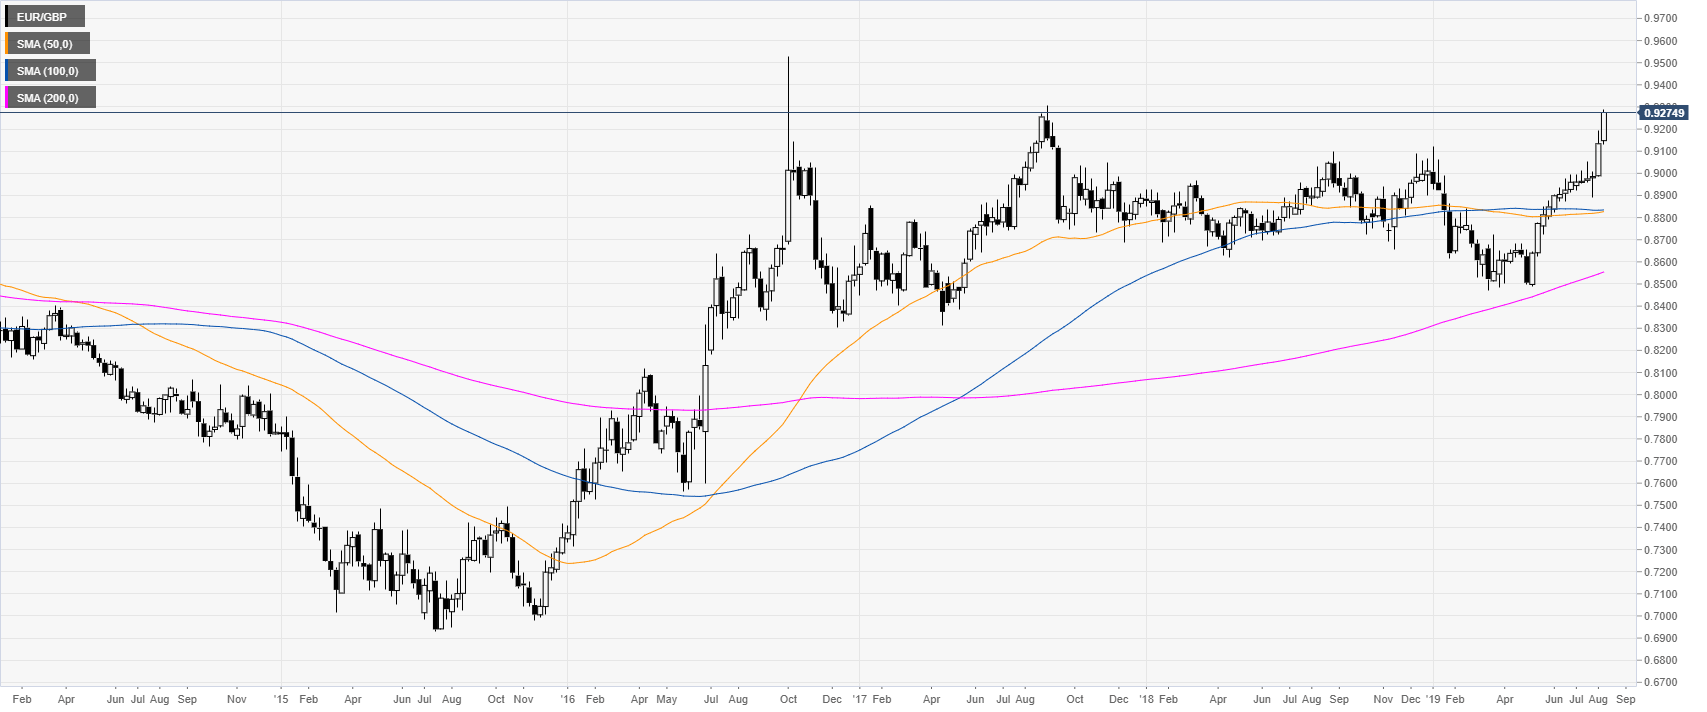
EUR/GBP weekly chart
EUR/GBP reached a new 2019 high this Friday as the bulls hit 0.9317 on an intraday basis. The market almost reached the August 29, 2017 high at the 0.9307 level.
EUR/GBP 4-hour chart
EUR/GBP is trading above its main SMAs as the buyers are in control. Their objective is to break above 0.9293 to reach 0.9313 and 0.9371 on the way up, according to the Technical Confluences Indicator.
EUR/GBP 30-minute chart
EUR/GBP is trading in a strong bull trend above its main SMAs. Pullbacks down could find potential supports at 0.9245 and the 0.9230 level, according to the Technical Confluences Indicator.
Additional key levels