WTI technical analysis: Buyers struggle around key resistance-zone
- 50-DMA and 38.2% Fibonacci retracement question WTI bulls.
- Four-month-old falling trend-line adds to the resistance.
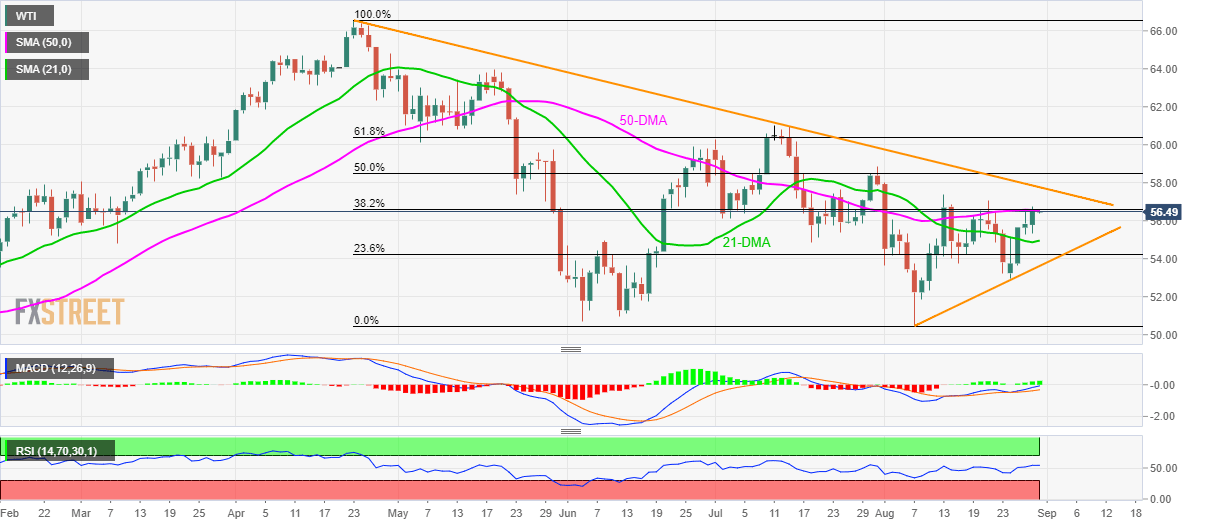
WTI buyers seem losing momentum as the oil benchmark seesaws near key resistance-confluence while taking rounds to $56.50 ahead of Friday’s European session.
The black needs to cross the $56.55/60 area including 50-day simple moving average (DMA) and 38.2% Fibonacci retracement of April-August downpour in order to extend the run-up towards a falling trend-line since late-April, at $57.80.
In a case where prices keep rallying above $57.80, July 31 high around $58.85, 61.8% Fibonacci retracement level of $60.40 and $61.00 comprising July month top will please the WTI bulls.
On the downside, 21-DMA level of $55.00 and 23.6% Fibonacci retracement of $54.25 can entertain sellers ahead of challenging the momentum with three-week-old rising trend-line at $53.50.
WTI daily chart

Trend: pullback expected
