Back
5 Dec 2019
US Dollar Index price analysis: DXY trading near 97.40 level, under pressure below the 200 DMA
- DXY is continuing the slow and gradual decline started at the start of the week.
- A drop to the 97.20 level seems virtually inevitable.
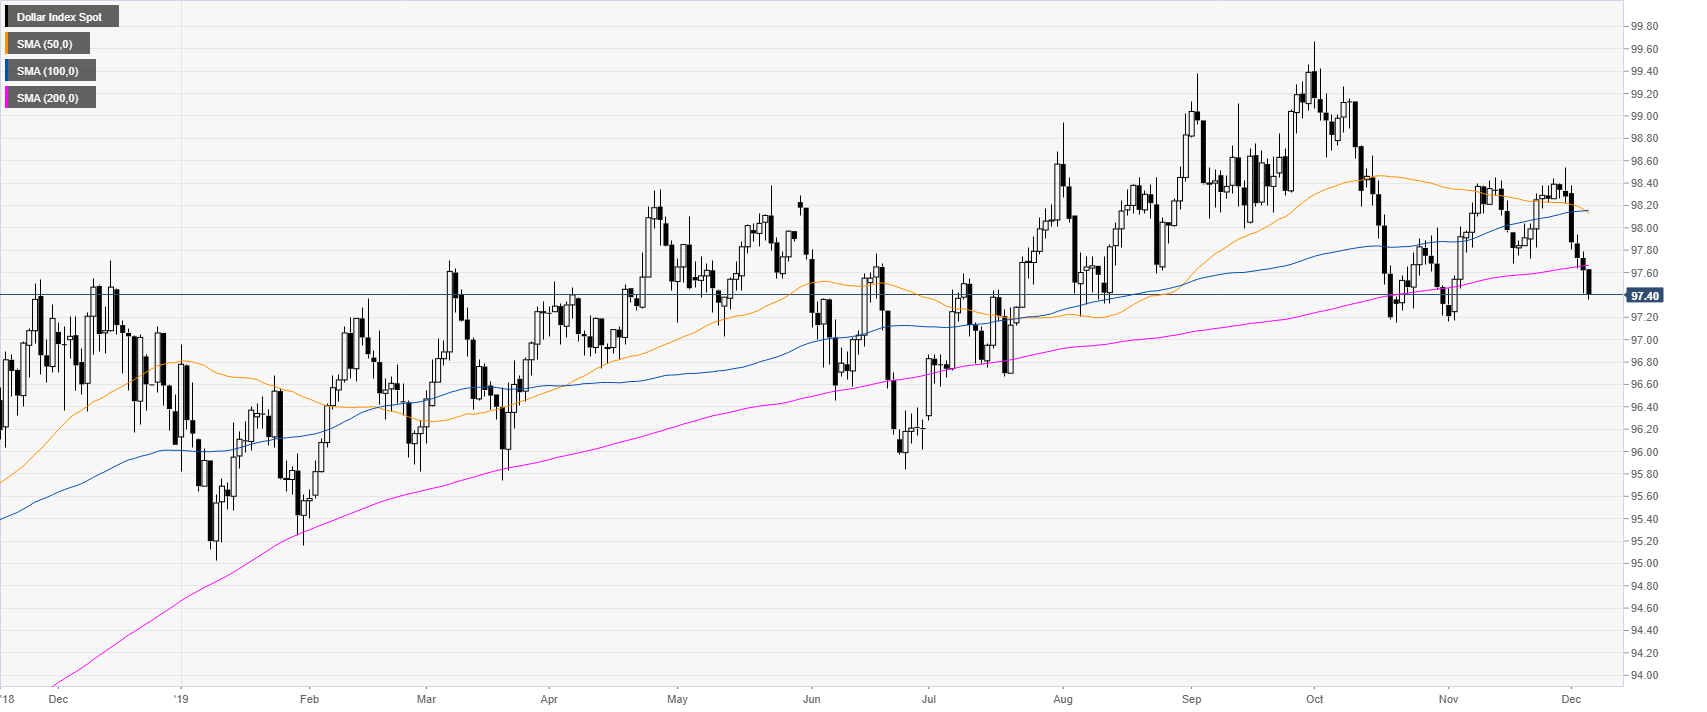
DXY daily chart
DXY (US Dollar Index) is trading in a weak uptrend. However, the market is below the 200-day simple moving average (DMA), suggesting that the index is weakening considerably.
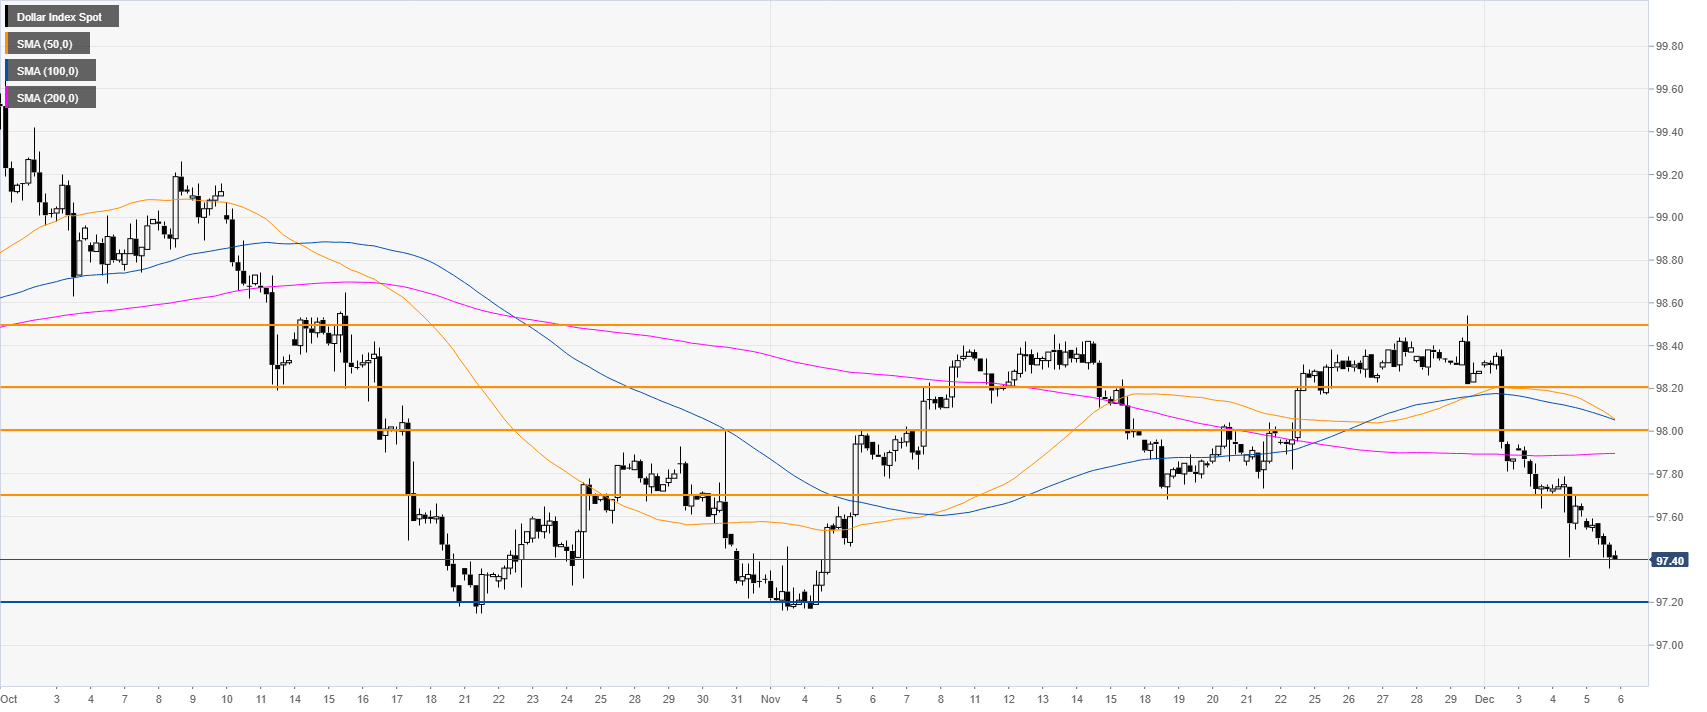
DXY four-hour chart
DXY is grinding lower while trading below its main SMAs. A drop to the 97.20 support level seems almost inevitable as bulls seem to have given up for the time being.
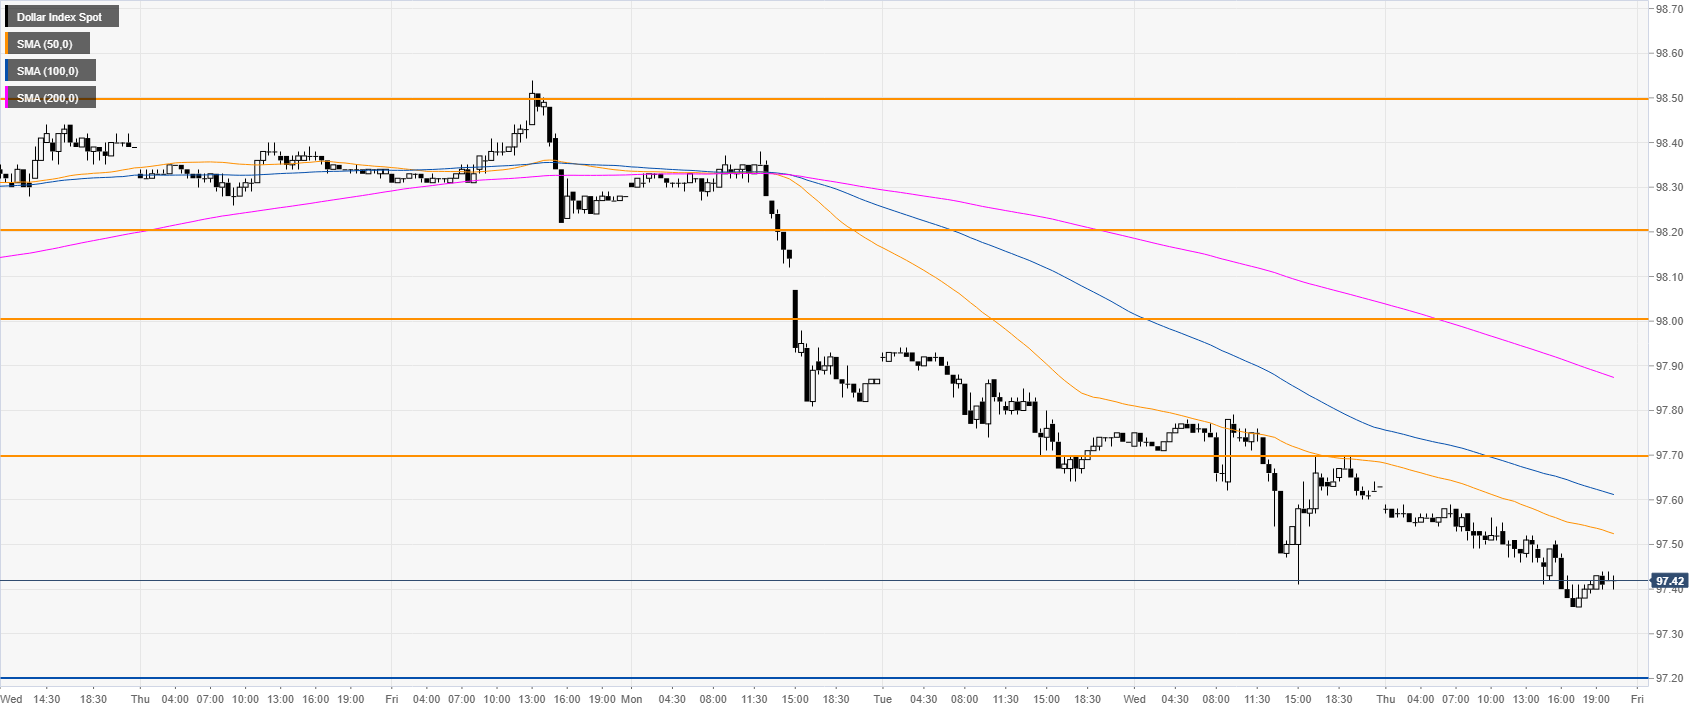
DXY 30-minute chart
The greenback is under selling pressure below the main SMAs. Resistance can be expected near the 97.70 and 98.00 levels in the short term.
Additional key levels