USD/JPY has more room to rise after topping 110 – Confluence Detector
Dollar/yen has taken advantage of the optimism around trade talks and topped 110. Can it continue higher? The technicals look upbeat.
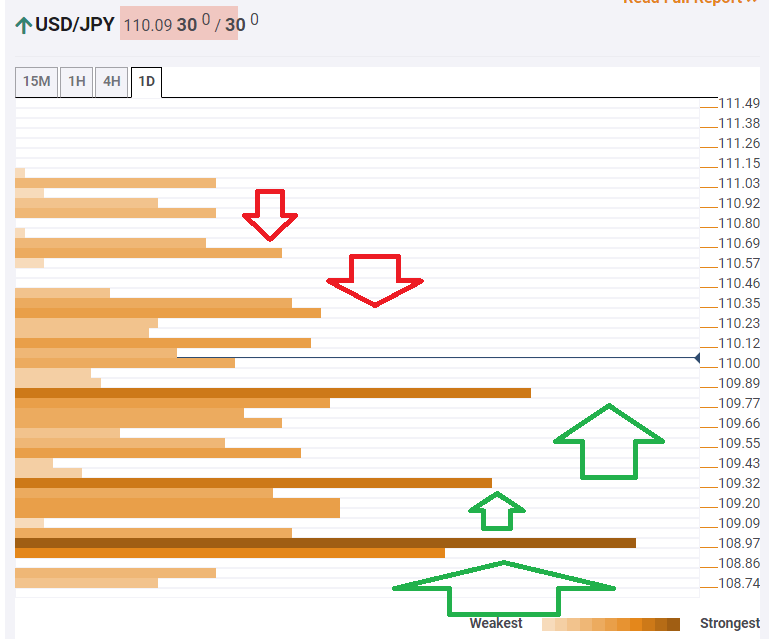
The Technical Confluences Indicator is showing that USD/JPY is trading above solid support at 109.82, which is the convergence of the Bollinger Band 1h-Lower, the previous monthly high, and the Fibonacci 23.6% one-day.
It is backed up by 109.32, where we see the confluence of the Fibonacci 61.8% one-month, the Pivot Point one-day Support 2, and the Simple Moving Average 5-one-day.
Further down, the most significant support is at 108.97, which is where the Fibonacci 38.2% one-month, the SMA 200-1h, the SMA 50-4h, and the Fibonacci 38.2% one-week meet.
Looking up, minor resistance awaits at 110.29, which is a juncture including the PP one-week Resistance 1, the PP one-day R2, and the PP one-month R2.
Further above, the next target is 110.63, which is where the Fibonacci 161.8% one-month and the PP one-day R3 converge.
Here is how it looks on the tool:
Confluence Detector
The Confluence Detector finds exciting opportunities using Technical Confluences. The TC is a tool to locate and point out those price levels where there is a congestion of indicators, moving averages, Fibonacci levels, Pivot Points, etc. Knowing where these congestion points are located is very useful for the trader, and can be used as a basis for different strategies.
This tool assigns a certain amount of “weight” to each indicator, and this “weight” can influence adjacents price levels. These weightings mean that one price level without any indicator or moving average but under the influence of two “strongly weighted” levels accumulate more resistance than their neighbors. In these cases, the tool signals resistance in apparently empty areas.
Learn more about Technical Confluence