USD/JPY has recaptured strong support ahead of the Fed – Confluence Detector
Dollar/yen has recovered and now faces the first Federal Reserve decision of the year. How is it technically positioned?
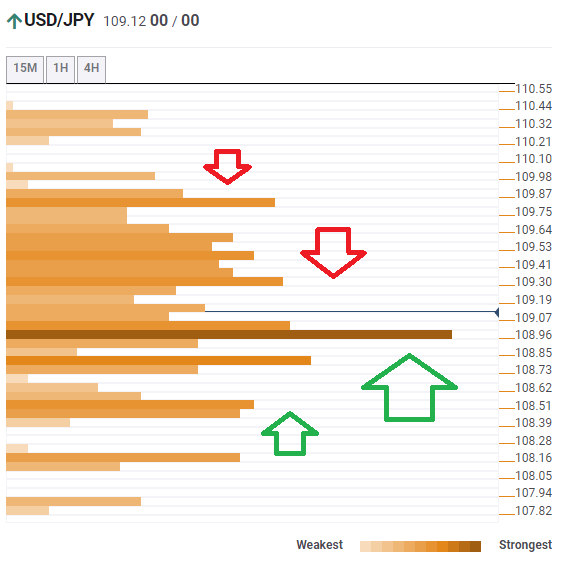
The Technical Confluences Indicator is showing that USD/JPY is trading above a significant cluster of support lines at 108.96, which includes the Bollinger Band 1h-Lower, the Fibonacci 61.8% one-day, and the Fibonacci 38.2% one-month.
Further down the line, another substantial cushion is at 108.39, which is the convergence of the Pivot Point one-day Support 3, the previous monthly low, and the Fibonacci 161.8% one-day.
Resistance is at 109.30, which is the confluence of the Fibonacci 61.8% one-month and the PP one-day Resistance 1.
Further up, 109.81, which is the meeting point of the Fibonacci 61.8% one-week and the previous month's high.
Here is how it looks on the tool:
Confluence Detector
The Confluence Detector finds exciting opportunities using Technical Confluences. The TC is a tool to locate and point out those price levels where there is a congestion of indicators, moving averages, Fibonacci levels, Pivot Points, etc. Knowing where these congestion points are located is very useful for the trader, and can be used as a basis for different strategies.
This tool assigns a certain amount of “weight” to each indicator, and this “weight” can influence adjacents price levels. These weightings mean that one price level without any indicator or moving average but under the influence of two “strongly weighted” levels accumulate more resistance than their neighbors. In these cases, the tool signals resistance in apparently empty areas.
Learn more about Technical Confluence