GBP/USD Price Analysis: On the back foot below 100-day SMA
- GBP/USD stays mildly negative near a 12-week low.
- Bearish MACD, a sustained break of the key SMA signal further declines.
- A confluence of 200-day SMA, 61.8% Fibonacci retracement acts as the key support.
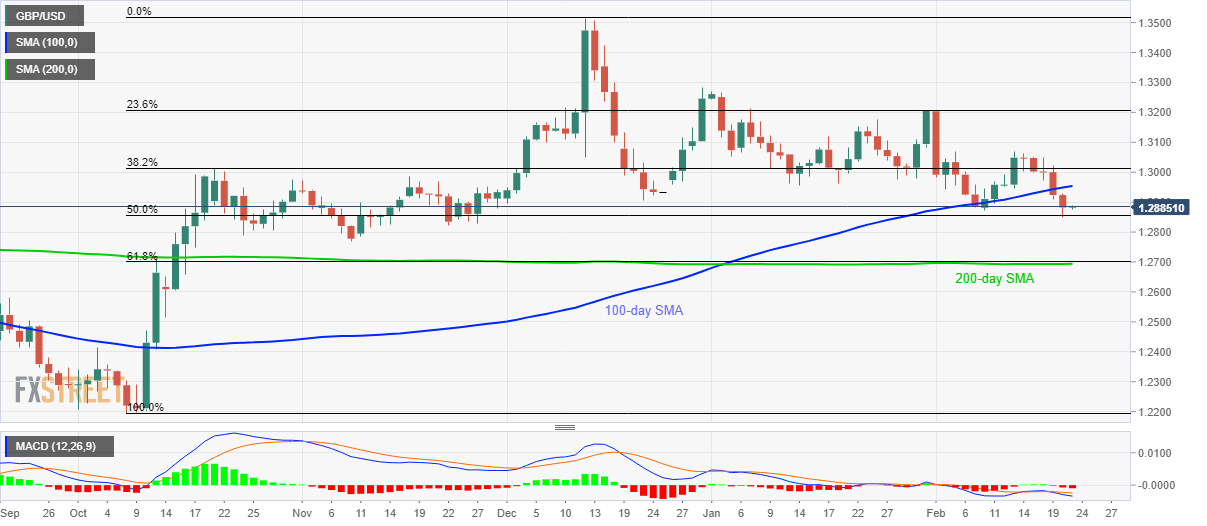
GBP/USD bears catch a breath near 1.2885, +0.02%, during Friday’s Asian session. The pair dropped to the lowest since November 27, 2019, the previous day. However, it failed to close below 50% Fibonacci retracement of October-December 2019 upside despite extending declines below 100-day SMA.
Hence, sellers will wait for entry below 50% Fibonacci retracement level of 1.2855 while taking aims at November 2019 monthly low near 1.2770.
It should, however, be noted that a confluence of 200-day SMA and 61.8% Fibonacci retracement could challenge the bears around 1.2700/2695 afterward.
Considering the bearish MACD signals and the pair’s sustained trading below the key SMA, GBP/USD prices are likely to remain weak for the time being.
Meanwhile, a daily closing beyond 100-day SMA level of 1.2955 can recall 1.3000 mark to the charts whereas February 13 top surrounding 1.3070 and 23.6% Fibonacci retracement at 1.3206 can entertain the bulls during further upside.
GBP/USD daily chart
Trend: Bearish