AUD/JPY Price Analysis: Justifies Tuesday’s bearish spinning top
- AUD/JPY extends the previous day’s losses from the five-day high.
- The spinning top suggests a lack of clarity among the pair traders.
- A confluence of 10-day SMA, weekly falling trend line restricts immediate upside.
- 200-day SMA offers strong downside support amid bearish MACD.
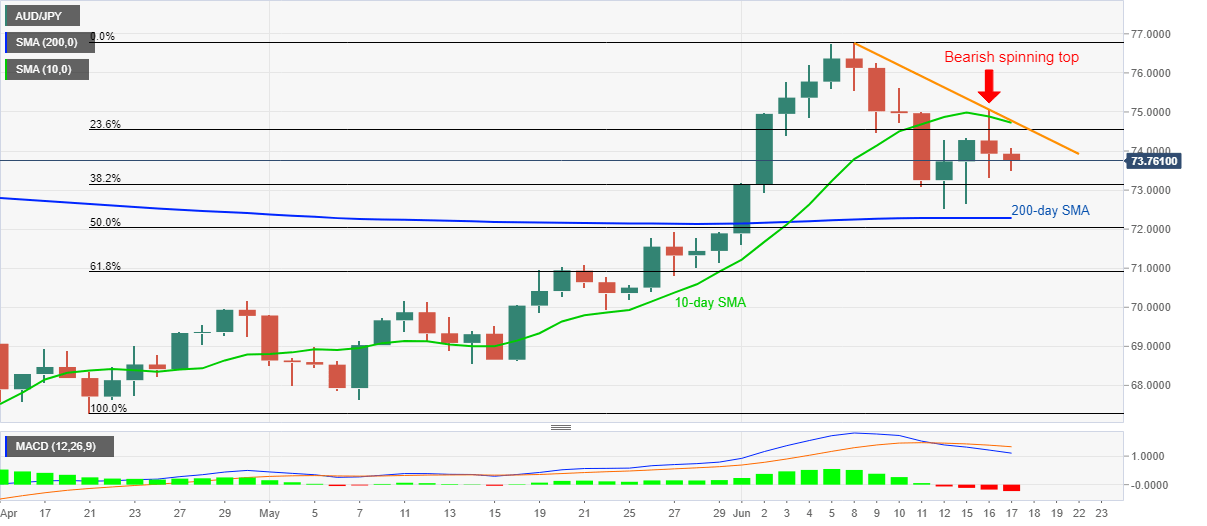
AUD/JPY drops to 73.76, down 0.30% on a day, during Wednesday’s Asian session. The pair stepped back from the highest since June 10 the previous day to snap the earlier two-day winning streak. In doing so, it formed a ‘bearish spinning top’ candlestick pattern on the daily chart.
Fundamentally, a mixed play between Australia’s Westpac Leading Index and HIA New Home Sales join the market’s risk-reset to exert downside pressure on the quote.
Considering the pair’s latest weakness, backed by downbeat candlestick formation and bearish MACD signals, sellers may again aim for a 200-day SMA level of 72.28 during the further declines. However, 38.2% Fibonacci retracement level of April-June run-up, at 73.15, could offer intermediate support.
In the case where the quote stretch declines below 200-day SMA, the late-May high surrounding 71.93 and 61.8% Fibonacci retracement level of 70.90 will be the key to watch.
On the upside, 23.6% Fibonacci retracement level of 74.54 may act as immediate resistance ahead of the joint between 10-day SMA and a falling trend line from June 08, around 74.70/75.
It should, however, be noted that a sustained rise past-74.75 enables the bulls to challenge them monthly high near 76.80.
AUD/JPY daily chart.
Trend: Further downside expected