NZD/USD Price Analysis: Sellers flirt with 0.6700 amid bearish MACD
- NZD/USD struggles to keep bounces off 50-bar EMA.
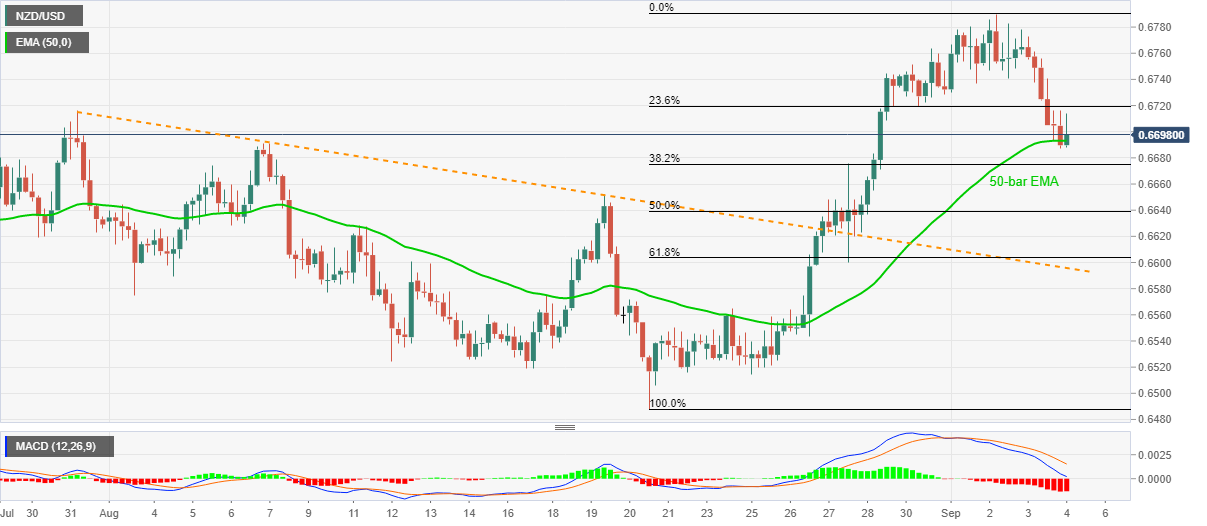
- The key Fibonacci retracement levels, falling trend line from July 31 act as additional supports.
- Ascending trend line from June 09 becomes important resistance.
NZD/USD seesaws around the weekly lows while taking rounds to 0.6700, down 0.20% on a day, during the early Friday’s trading. In doing so, the kiwi pair attempts recovery from 50-bar EMA but bearish MACD and sustained trading below July month top keeps the sellers hopeful.
As a result, any more pullbacks towards 0.6720 become an opportunity to sell while targeting 50% and 61.8% Fibonacci retracements of the pair’s upside from August 20 to September 02, respectively around 0.6640 and 0.6600.
It should, additionally, be noted that any more weakness below 0.6600 will be probed by a five-week-old falling trend line, previous resistance, around 0.6595.
Alternatively, the pair’s upside moves past-0.6720 will have multiple resistances around 0.6740/45, a break of which can challenge the monthly top close to 0.6790.
During the quote’s sustained run-up beyond 0.6790, an ascending trend line from the early June month around 0.6805 will be the key to watch.
NZD/USD four-hour chart
Trend: Further weakness expected