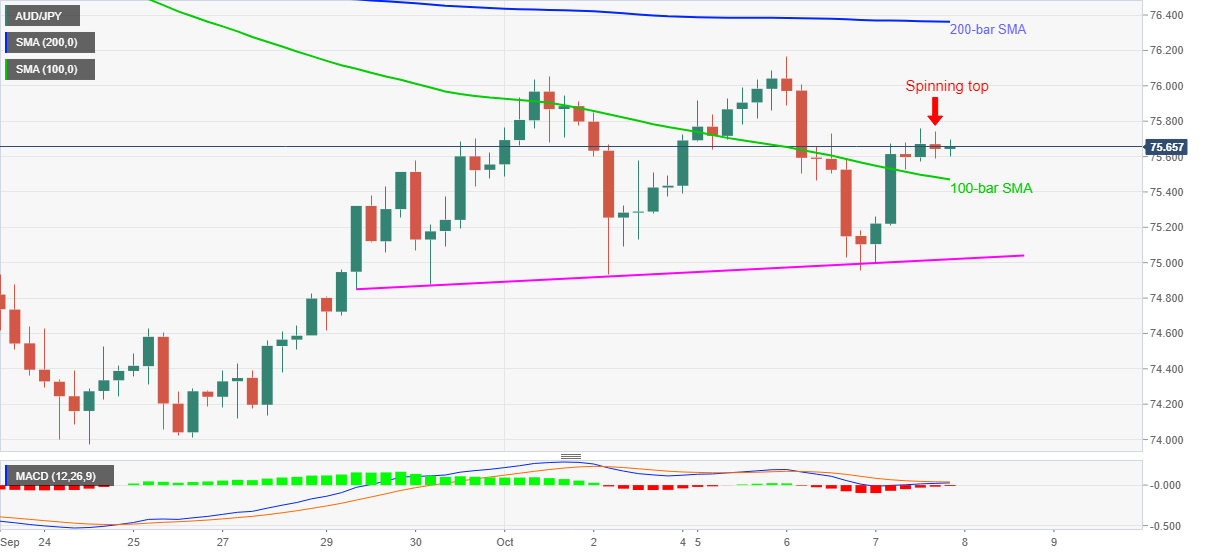
AUD/JPY Price Analysis: Spinning top on 4H portrays traders’ indecision below 76.00
- AUD/JPY wavers in the range between 75.58 and 75.75.
- MACD flirts with bulls, favors the run-up towards 200-bar SMA.
- 100-bar SMA, one-week-old ascending trend line offer immediate support.
AUD/JPY treads water around 75.65 during the early Thursday morning in Asia. In doing so, the pair prints a spinning top candlestick on the four-hour (4H) chart while keeping the 75.58-75 trading range.
Although the candlestick marks traders’ indecision, MACD flirts with the bulls as the quote remains above 100-bar SMA.
As a result, AUD/JPY buyers will be delighted to take entries once the cross breaks the upper end of the latest range, 75.75. This will help the buyers to confront the 76.00 threshold while targeting Tuesday’s top surrounding 76.15.
It should, however, be noted the pair’s upside past-76.15 will be probed by a 200-bar SMA level of 76.36.
Alternatively, a downside break of 100-bar SMA, currently around 75.47, will drag the AUD/JPY prices toward an ascending trend line from September 29, at 75.00 now.
AUD/JPY four hour chart
Trend: Sideways