AUD/JPY Price Analysis: Erases last week’s gains, refreshes two-week lows around 92.99
- AUD/JPY snaps two days of gains, plunges more than 150 pips on risk aversion.
- Weaker economic China and US data, drivers of risk-off impulse in the FX space.
- AUD/JPY Price Analysis: Falling-wedge in the hourly chart might open the door for a leg-up before resuming the downtrend.
After a risk-off impulse in the FX space, the AUD/JPY plunges from around three-week highs around 95.05 and dives towards the 100-day EMA to record its daily low near 92.99 on Monday, courtesy of weaker China and US data, which reignited recession fears. At the time of writing, the AUD/JPY is trading at 93.54.
AUD/JPY Price Analysis: Technical outlook
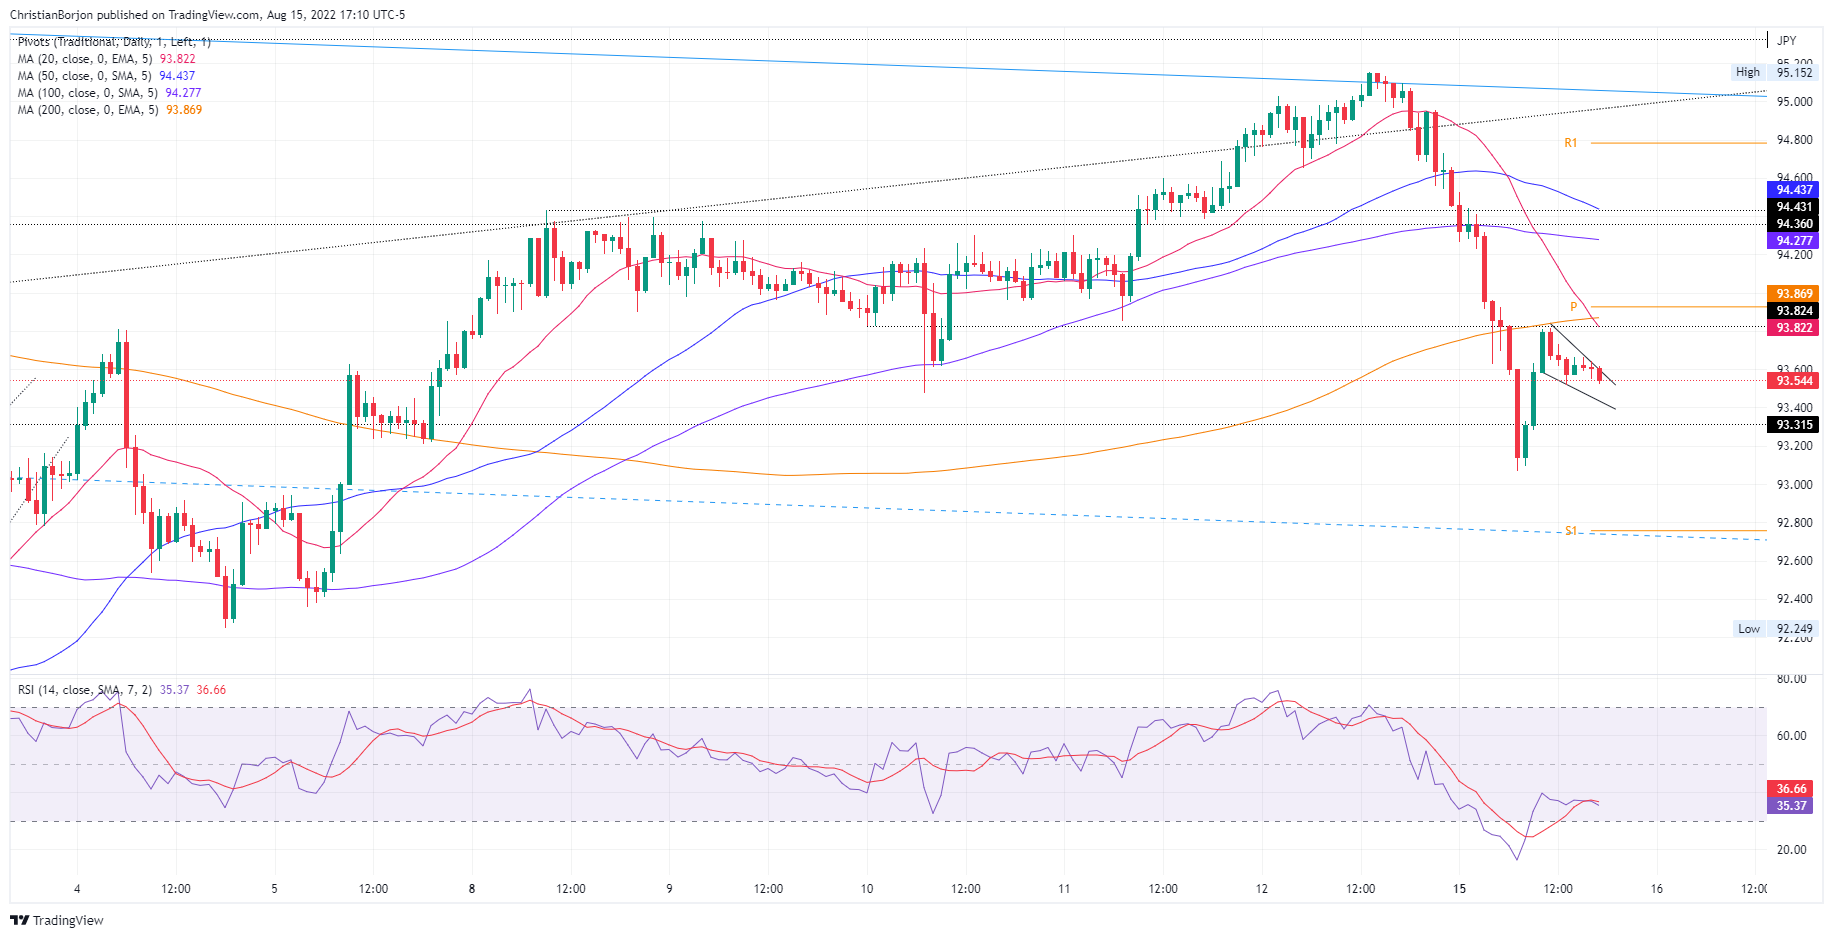
The AUD/JPY remains trading within the boundaries of a descending channel, as portrayed on Monday. The high of the day was also the top-trendline of the previously mentioned channel, in which sellers leaned on to drive prices lower, sending the pair plunging close to 150 pips, near the 100-day EMA. Nevertheless, an uptick in the Relative Strength Index (RSI), and US traders’ sentiment improvement, capped the downtrend, so the pair closed near the August 10 low at 93.48.
Zooming into the 1-hour scale, the AUD/JPY is neutral to upward biased, with the chart portraying the formation of a falling wedge, which would open the door for further upside before resuming its downtrend. Also, to further confirm the previously mentioned, RSI is about to cross over its 7-hour RSI SMA, which would accelerate the uptrend.
Therefore, the AUD/JPY first resistance would be 93.81; once cleared, it would open the door towards the confluence of the 20/200-hour EMA at 93.86, closely followed by the 100-hour EMA at 94.28.
 AUD/JPY Hourly chart
AUD/JPY Key Technical Levels